Breaking News: #DataViz Headline Challenge—Congratulations to our Winners!
April 19, 2022
This spring, The New York Times Learning Network’s “What’s Going on in This Graph?” and the American Statistical Association teamed up for the This is Statistics 2022 Spring Contest.
For this year’s Breaking News: #DataViz Headline Challenge, students showcased their statistical literacy and journalism skills by submitting clear and compelling headlines for The New York Times graphs in four weekly challenges throughout the month of March. At the end of each week, a distinguished panel of judges made up of experts from the American Statistical Association and The New York Times Learning Network reviewed the submissions to identify the week’s top headlines.
The #DataViz Headline Challenge received 1,038 student headline submissions from more than 500 students across the country and the world.
The overall winners comprised six high school students, and four undergraduate students from across the country and the world, with some ties.
Congratulations to our winners!
Middle School & High School Winners
First Place
Headline: Road to Success: Global Gen Zers Envision Different Paths (view the Week 1 Graph)
Student: James Roberts
Sponsor: Laura Ringwood
School: West Lake High School, Austin, Texas
Headline: Gas, Milk, and Meat, Oh My! Consumers Notice Price Increase of Basic Items (view the Week 4 Graph)
Student: Mary Lousia Leopold
Sponsor: Ms. Sylvia
School: School Without Walls High School, Washington, DC
Second Place
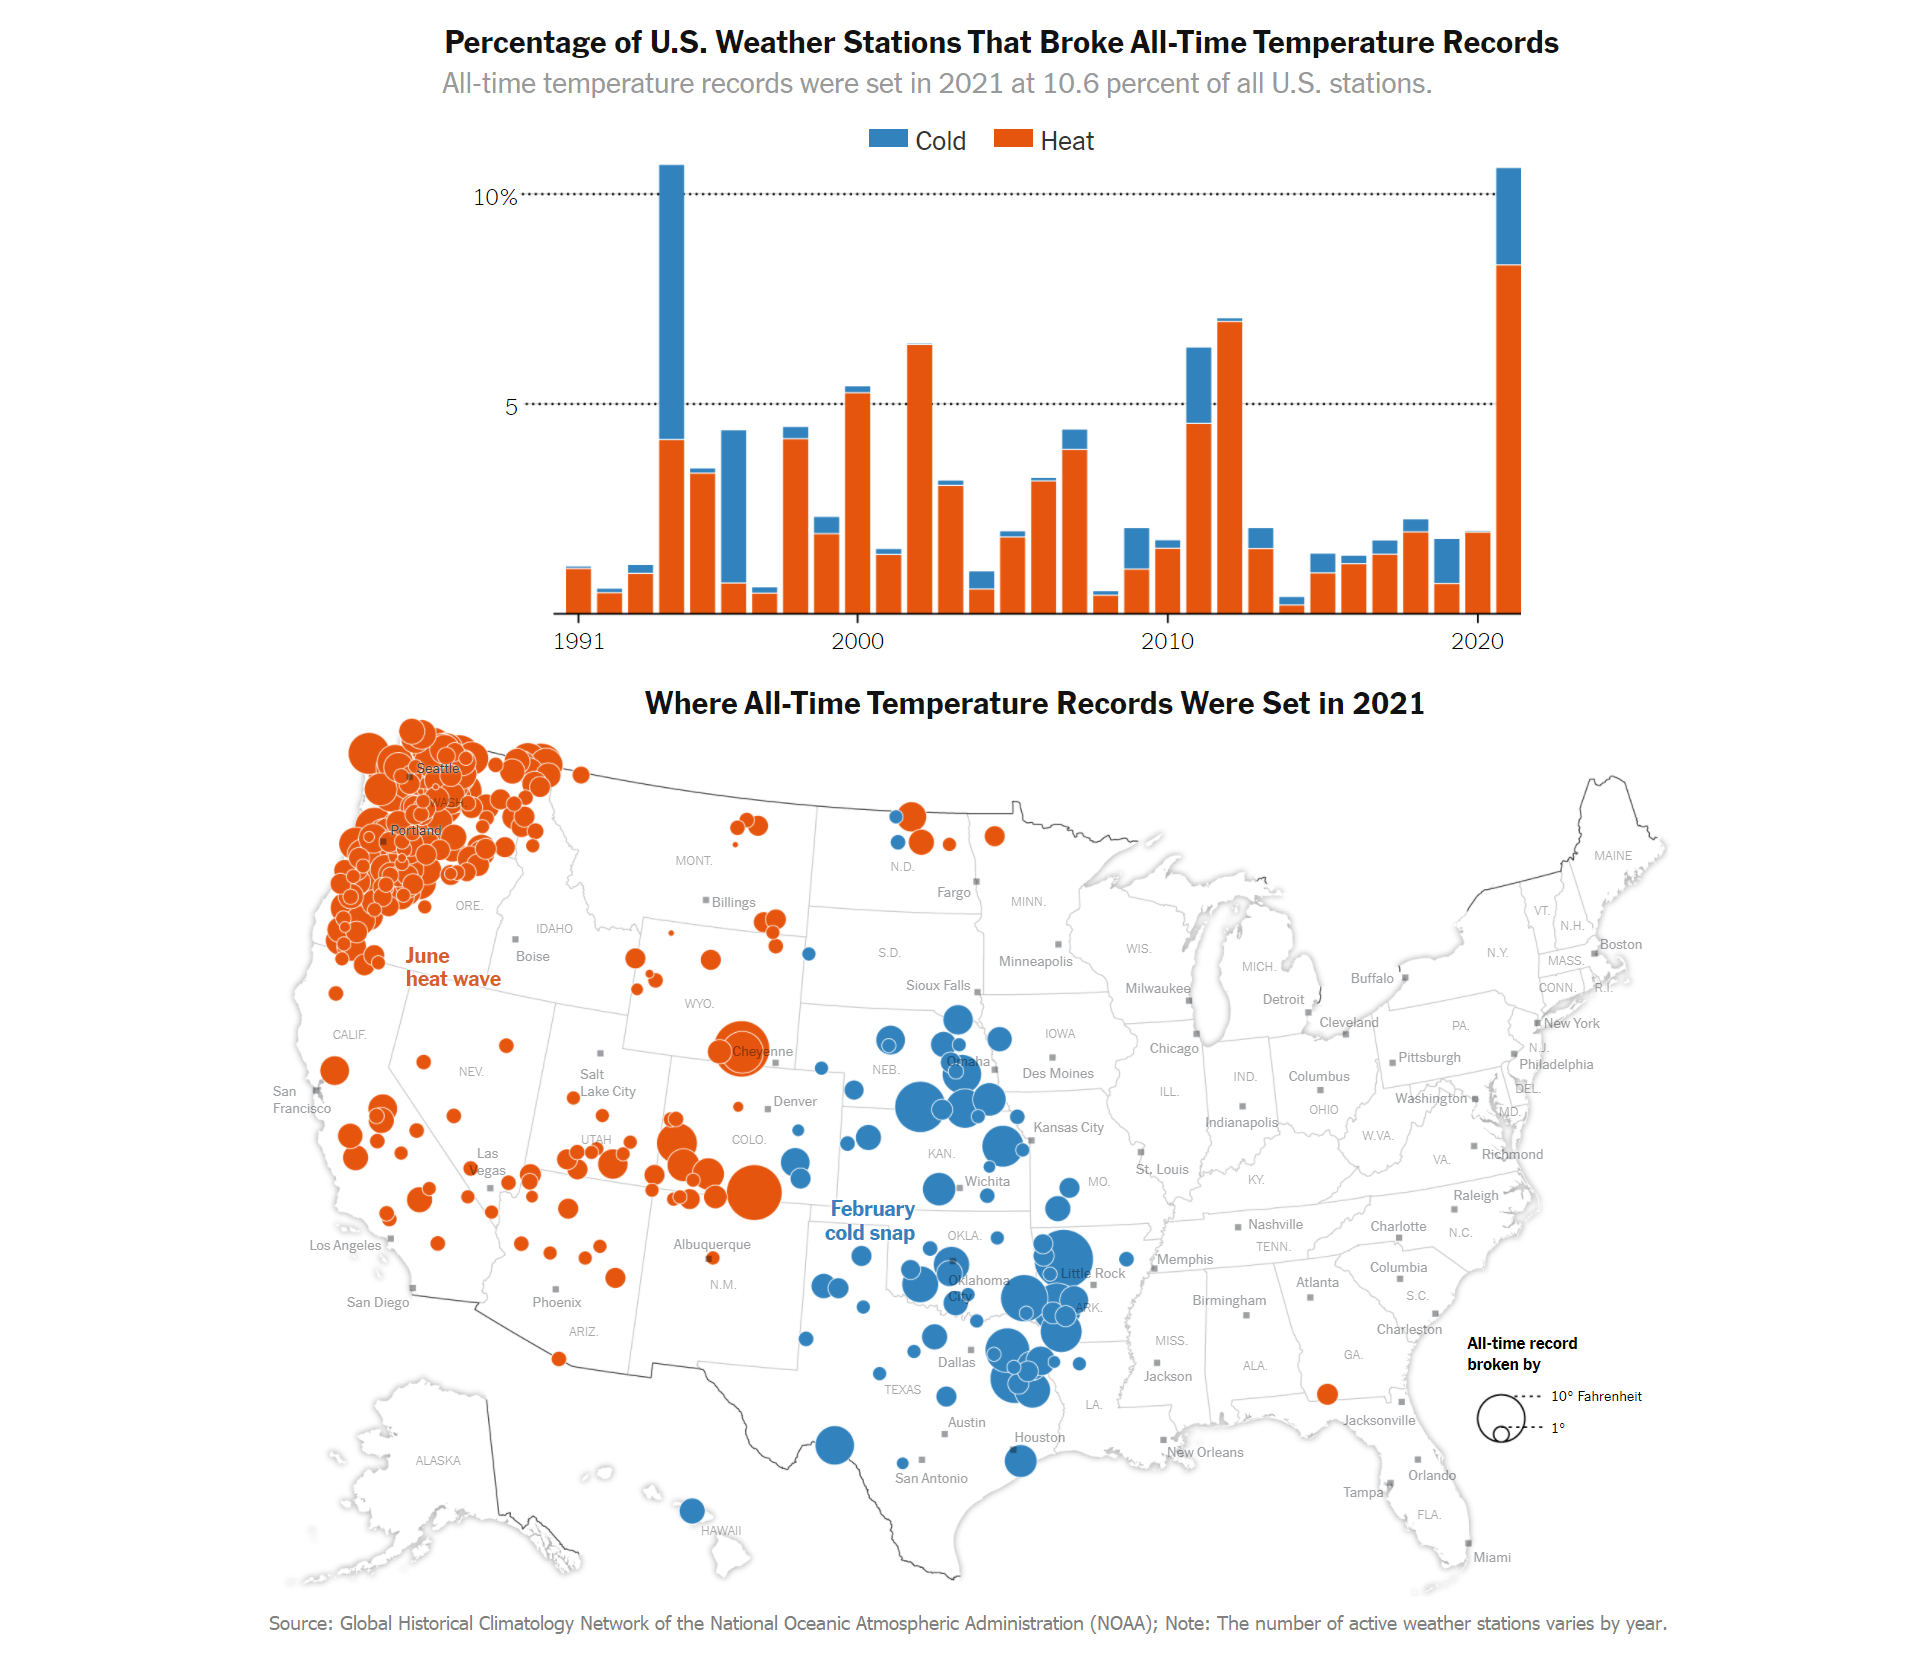
Headline: Scorching Heat to Chilling Cold: 2021’s Weather Breaks Records (view the Week 2 Graph)
Student: Supra Kuchibhatla
School: International Academy East High School, Troy, Michigan
Headline: Wallet feeling light? Americans say the price of necessities like gas and food is creeping higher (view the Week 4 Graph)
Student: Alex J. Choi
School: Crean Lutheran High School, Irvine, California
Third Place
Headline: Cool or shine, it’s not divine in 2021: 10.6% of weather records broken in South or West at peak (view the Week 2 Graph)
Student: Samuel Jebaraj
Sponsor: Claudia Smith
School: Valley Christian High School, San Jose, California
Headline: INFLATION AGITATION: Americans Feeling Pain at the Pump and Dinner Table (view the Week 4 Graph)
Student: Winston Li
Sponsor: Claudia Smith
School: Valley Christian High School, San Jose, California
Undergraduate Winners
First Place
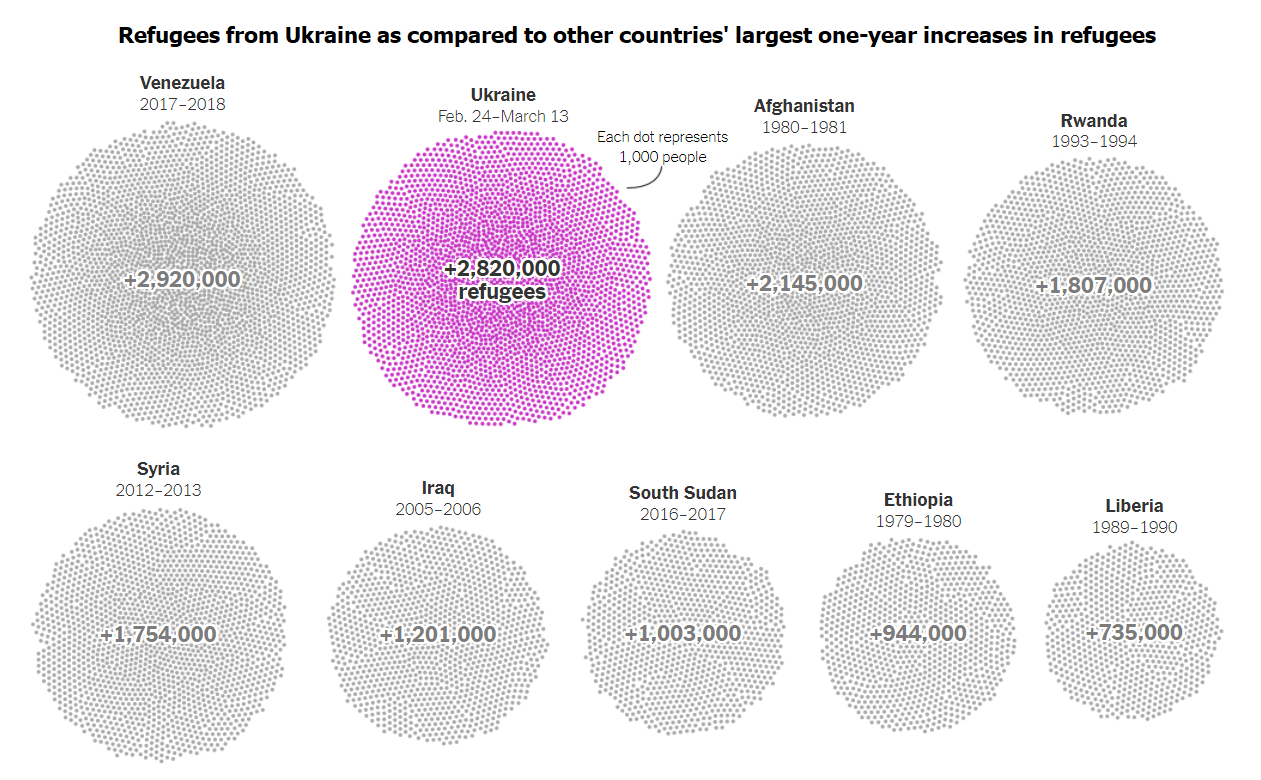
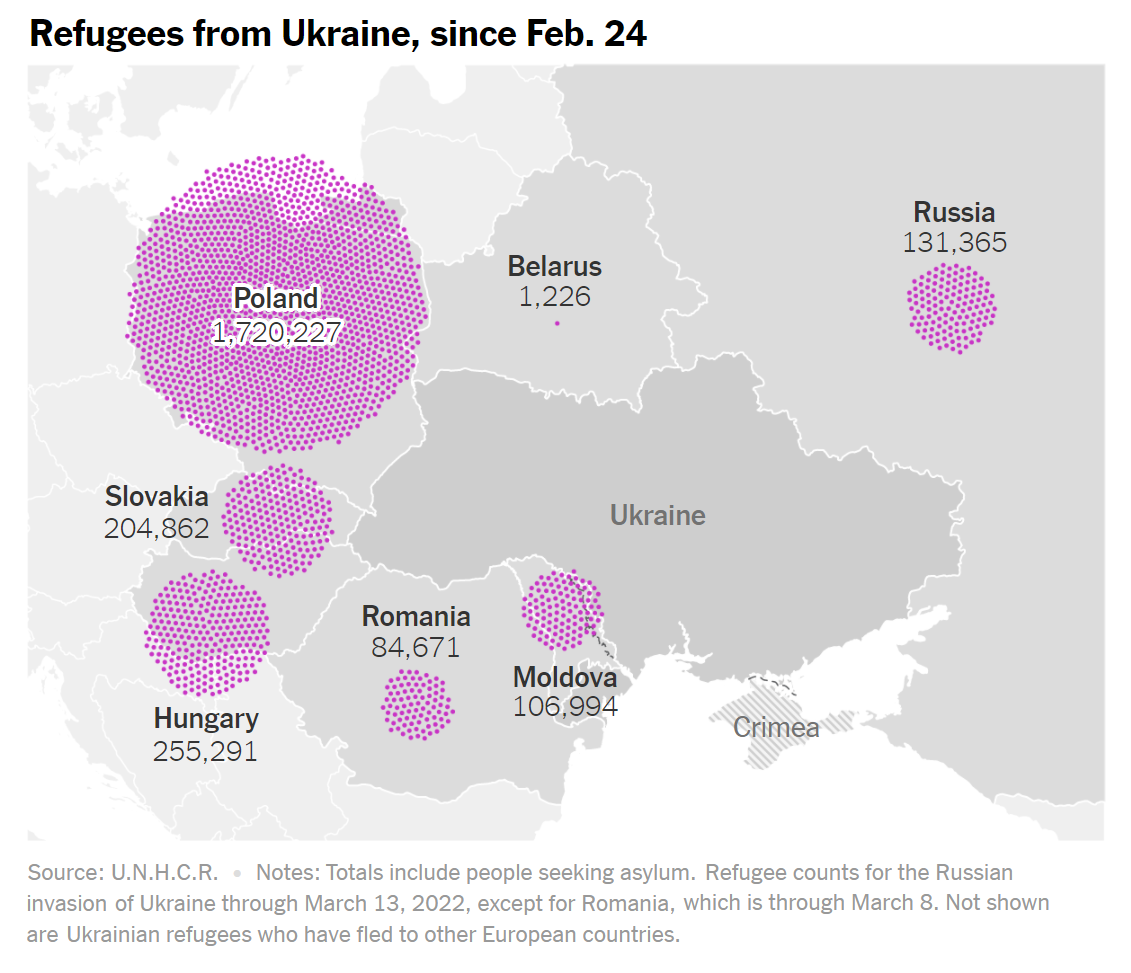
Headline: Ukrainian Refugee Flows Poised to Break Records, With Most Headed to Poland (view the Week 3 Graph)
Student: Zoe Spicer
Sponsor: Jacob Smith
School: Duke University, Durham, North Carolina
Second Place
Headline: Leading Factors of Success: How Young Americans Differ from Other Nations History (view the Week 1 Graph)
Student: Vanessa Ortiz
School: University of Florida, Gainesville, Florida
Third Place
Headline: Roots of success according to 15-24 year-olds (view the Week 1 Graph)
Headline: Purchasing Power: Products and Services that have seen their prices rise dramatically according to Consumers (view the Week 4 Graph)
Student: Tropel Célia
Sponsor: Lynn-Martinsons Nadine
School: Université Grenoble Alpes, Grenoble, France
Headline: Gen Z’s Story: My Success, My Business. But Their Country’s Level of Income May Have A Say (view the Week 1 Graph)
Student: Quynh Anh Nguyen
School: University of South Florida, Tampa, Florida
Educator Winner
In addition to the student contest, This is Statistics encouraged educators to briefly, tell us how they use “What’s Going On In This Graph?” or the #DataViz Headline Challenge in their classrooms. Those who participated were eligible for a randomly selected winner to win a gift card, and to be featured in upcoming This is Statistics and New York Times Learning Network content to share their insights with other educators.
By random selection, our winner is Claudia Smith!
Ms. Smith said:
“I use the DataViz Headline Challenge as a weekly assignment. My students love the challenge of getting to be creative in creating a headline that showcases their understanding of the data visualization as well as journalism skills. They provide proof that they submitted a headline by forwarding the confirmation email to me. That allows me to see what they submitted and provide general feedback to my classes about what makes a great headline.”
Stay tuned for a roundup of educator tips and advice later this month.
Thank you to all who participated in the #DataViz Headline Challenge!
Be the first to know about future contests by signing up for our email list.
Weekly Challenge Graphs

Week 1 Graph
Week 2 Graph
Week 3 Graph, Part A
Week 3 Graph, Part B

Week 4 Graph
Related Posts

Hindsight Is 2023 for Former Statistics and Data Science Students
It’s back-to-school season! Gear up for the upcoming semester and consider diving into the captivating world of statistics and data science. Looking for diverse job opportunities that span across every industry? Look no further! With a variety of graduate programs and jobs, now is a great time for students to become data scientists and statisticians….
Elizabeth J. Kelly: “Statistics is for Adrenaline Junkies”
Elizabeth J. Kelly has always loved math, and as a professional statistician at Los Alamos National Laboratory (LANL) and a recreational rock climber, Elizabeth is an avid thrill-seeker who enjoys a challenge. “Math reminds me of climbing, including the need to focus, problem solve and persevere. I guess I ended up in statistics because I…