Breaking News: #DataViz Headline Challenge – Week Three
This is Statistics’ spring #DataViz Headline Challenge provides students with the opportunity to showcase their statistical literacy and journalism skills by submitting a clear and compelling headline for New York Times graphs in four weekly challenges. Finalists will be published on the This is Statistics website each week and top winners will get prizes.
The submission form for week two has now closed. Check back on Monday, March 28, to find out who the finalists are for this round!
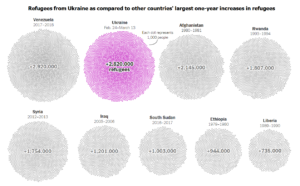
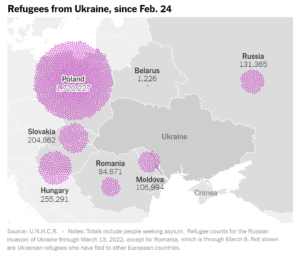
WEEK THREE:
In Week Three of the #DataViz Headline Challenge, you will analyze the following graphs prior to crafting your headline. To find high resolution images of part one, click here, and part two, click here.
Updated contest challenges and outcomes will be posted weekly.
Educators, here’s your opportunity to participate, too! Briefly, tell us how you use the New York Times Learning Network’s “What’s Going On In This Graph?” or the 2022 Spring Challenge in your classroom. Your response may be featured online and you will be entered into a random drawing for a gift card.
Questions? Contact us at thisisstats@gmail.com.