
Meet Sharon Hessney, the Educator Behind the New York Times Learning Network’s “What’s Going On In This Graph?”
July 16, 2020
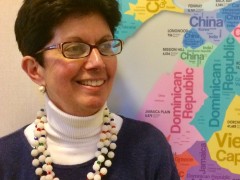 Sharon Hessney is an award-winning mathematics teacher in Boston and graph curator for the New York Times Learning Network’s “What’s Going In This Graph?” feature. She gave This is Statistics an in-depth look into her work and advice for students looking to start careers in the statistics field.
Who inspired you to work in statistics education?
The Advanced Placement Statistics community of experienced statistics teachers. AP Statistics emphasizes statistics with understanding in context. Coming from the business world, I find this to be a necessary approach to statistics.
What excites you about your work?
There are many ways to understand our world, including through data and statistics. But, to use statistics, there must be “good” data, statistics and analysis. Helping others get a deeper understanding through this kind of statistical thinking is what excites me about teaching statistics.
“Learn as much statistics as you can, not just the statistics for one field of application. Whatever field you go into, knowing more tools in the toolbox will be useful at some time.”
What is the best piece of advice you received from a mentor regarding statistics?
Gathering data, analyzing statistics, and communicating the findings are not easy. Work hard to understand the story of the data.
What advice would you give to students interested in working in the statistics field?
Learn as much statistics as you can, not just the statistics for one field of application. Whatever field you go into, knowing more tools in the toolbox will be useful at some time.
What message do you have for educators about statistics literacy?
In statistics, there is no one right answer, though there are definitely wrong answers. Never work alone. More heads are better than one. Uncovering the story of data is a reiterative process of making errors and re-analyzing. Have confidence that you will get closer to the data’s story, the more you collaborate and work.
How do you see COVID-19 changing the future of statistics?
The public is focusing on statistics as an important tool to understand COVID-19, as well as racial inequality. Many are realizing that “anecdote is not data.” They are learning that the best we may be able to do is to have an answer which is based on assumptions that even smart people may disagree about.
“In statistics, there is no one right answer, though there are definitely wrong answers. Never work alone. More heads are better than one.”
Tell us about your work with the New York Times Learning Network’s “What’s Going In This Graph?”
The New York Times Learning Network, in partnership with the American Statistical Association, has been publishing “What’s Going On In This Graph?“ since September 2017 (#NYTGraphChat on social media). This past year alone, there have been 32 free, online graph releases including seven COVID-19 graphs. (The first COVID-19 graph was in mid-February. The March 19 “Flatten the Curve” release has had 1,226 responses).
Our two editors, Roxy Peck and Erica Chauvet, and 26 live moderators ask students to notice and wonder about previously published New York Times graphs, from the cost of engagement rings, to missing busses, to crime by immigrants, to teenagers’ sports injuries and their mental health. This year’s total number of responses was 12,823, with quite a few from outside the United States. The number of views and the number of students whose teachers exposed them to “What’s Going On In This Graph?” could easily be more than tenfold this number.
Explore a complete archive, videos on how to use “What’s Going On In This Graph?” and indices of the releases by topic, graph type, and statistical concept here.
Related Posts

Hindsight Is 2023 for Former Statistics and Data Science Students
It’s back-to-school season! Gear up for the upcoming semester and consider diving into the captivating world of statistics and data science. Looking for diverse job opportunities that span across every industry? Look no further! With a variety of graduate programs and jobs, now is a great time for students to become data scientists and statisticians….

Elizabeth J. Kelly: “Statistics is for Adrenaline Junkies”
Elizabeth J. Kelly has always loved math, and as a professional statistician at Los Alamos National Laboratory (LANL) and a recreational rock climber, Elizabeth is an avid thrill-seeker who enjoys a challenge. “Math reminds me of climbing, including the need to focus, problem solve and persevere. I guess I ended up in statistics because I…