Florence Nightingale: The Lady with the Data
March 15, 2020
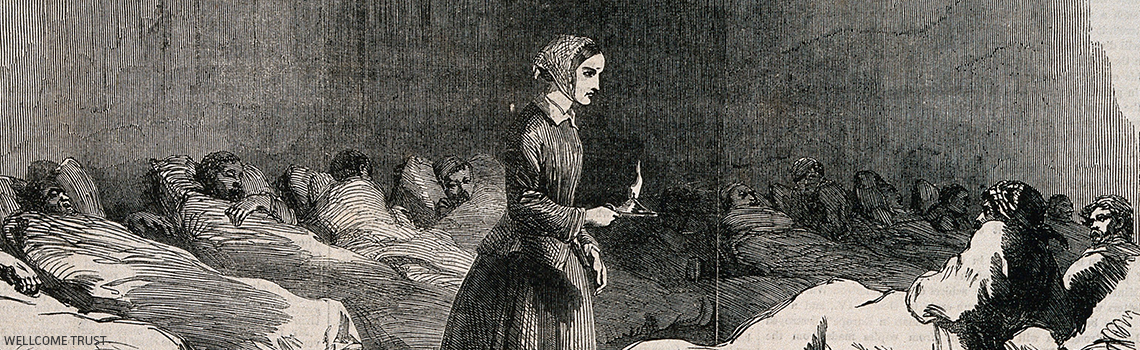
The lady with the lamp was also the lady who conducted pioneering and brave work as a statistician during a time when women were a rare presence in such fields. Florence Nightingale, one of the most prominent statisticians in history, used her passion for statistics to save lives of soldiers during the Crimean war, and do groundbreaking work in data visualization that continues to be influential to this day.
Statistics during the Crimean War
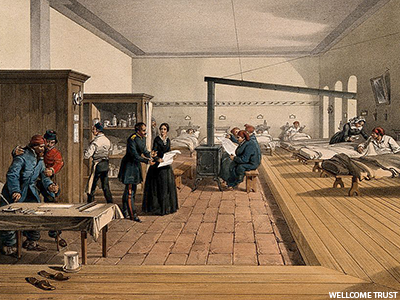 When Florence Nightingale arrived at the British military hospital in Turkey in 1856, the scene was pretty grim. The mortality rate was high, and the hospital was chaotic—even the number of deaths was not recorded correctly. Florence Nightingale established much needed order and method within the hospital’s statistical records.
She also collected a lot of new data. In doing so, Nightingale learned that poor sanitary practices were the main culprit of high mortality in hospitals. She was determined to curb such avoidable deaths. By using applied statistical methods, she made a case for eliminating the practices that contributed to the unsafe and unhealthy environment. Her work in statistics saved lives.
Data Visualization
Tables and diagrams fill the pages of Nightingale’s notes and records. Hundreds of years before the Adobe Creative Cloud hit the market and “infographics” were something we all needed, Nightingale made data beautiful.
Her most famous design, which we use in varying forms today, was the “coxcomb.” The coxcomb is similar to a pie chart, but more intricate. In a pie chart the size of the ‘slices’ represent a proportion of data, while in a coxcomb the length, which the slice extends radially from the center-point, represents the first layer of data.
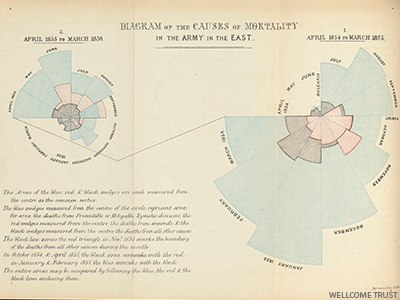 The specific organization of Nightingale’s chart allowed her to represent more complex information layered in a single space. In her coxcomb during the Crimean War, the chart was divided evenly into 12 slices representing months of the year, with the shaded area of each month’s slice proportional to the death rate that month. Her color-coding shading indicated the cause of death in each area of the diagram.
Nightingale is an enduring role model for women in the field of statistics; she paved the road in so many ways. Today we know statistics careers are growing in nearly every type of industry, but Florence Nightingale probably didn’t have many female statisticians to serve as role models in the 1850s. She was the “lady with the lamp” who will long be remembered for her trailblazing work in statistics.
Online
Edwin W. Kopf’s, “Florence Nightingale as Statistician”
The Guardian, “Florence Nightingale, Datajournalist: Information Has Always Been Beautiful”
Related Posts

Hindsight Is 2023 for Former Statistics and Data Science Students
It’s back-to-school season! Gear up for the upcoming semester and consider diving into the captivating world of statistics and data science. Looking for diverse job opportunities that span across every industry? Look no further! With a variety of graduate programs and jobs, now is a great time for students to become data scientists and statisticians….

Elizabeth J. Kelly: “Statistics is for Adrenaline Junkies”
Elizabeth J. Kelly has always loved math, and as a professional statistician at Los Alamos National Laboratory (LANL) and a recreational rock climber, Elizabeth is an avid thrill-seeker who enjoys a challenge. “Math reminds me of climbing, including the need to focus, problem solve and persevere. I guess I ended up in statistics because I…