
Prediction 2016 Results are In: Students Say Hillary Clinton Will Win Presidential Election in Historic Voter Turnout
Earlier this week, more than 450 high school and college students competing in ASA’s Prediction 2016 contest shared their predictions for the 2016 presidential election. Individual and team entries were submitted from 19 states and more than 30 academic institutions.
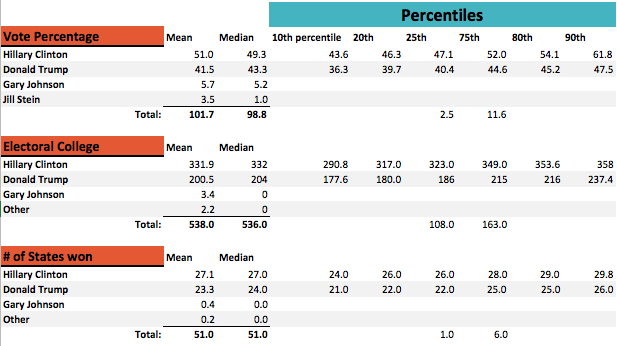
What did their analysis of publicly available data show? Overall, 97 percent of participants predicted that Hillary Clinton will be our next Commander in Chief. The median of contest participant projections show that Clinton will win 332 electoral votes to Trump’s 204, and 49.3 percent of the popular vote to Trump’s 43.3 percent.
To predict the winners, many students analyzed existing national and statewide polls, and weighted them according to a variety of factors. Some students also analyzed demographic data to identify trends in voting. Methods varied from taking averages of polls to running linear regression and time series analysis.
Among key projections based on the collection of student entries:
- Clinton will win 26 states (and the District of Columbia) to Trump’s 24 states.
- Among the battleground states, Trump will win Arizona, Iowa and Ohio and Clinton will win Florida, Nevada and North Carolina.
- 132 million voters will cast ballots in the 2016 election, the largest voter turnout in absolute numbers in United States history.
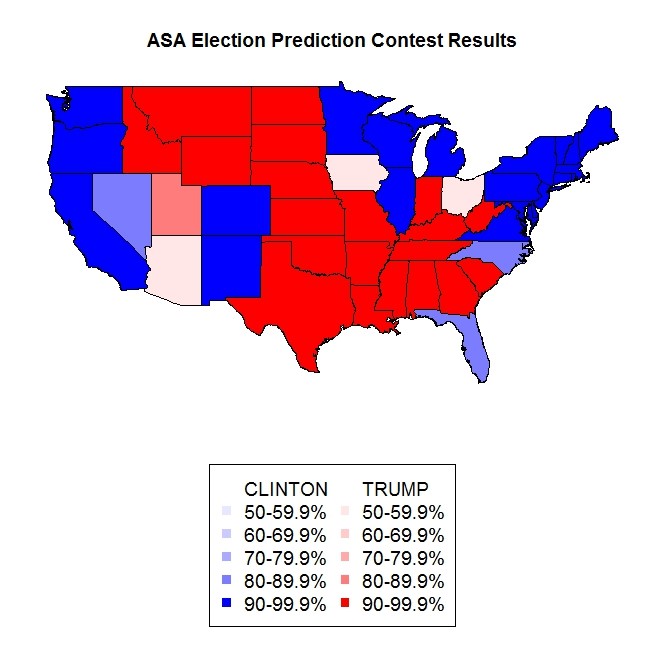
For a state-by-state view, this map shows Clinton victories in blue and Trump wins in red. In all but Arizona, Iowa, and Ohio, more than 80 percent are in agreement. Ohio is especially close with 97 teams predicting Trump as the winner, 92 Clinton, and four predicting Gary Johnson or other. 98 teams predict Trump will claim Iowa, as do 90 Clinton, and five Gary Johnson or other. In Arizona, 113 predict Trump will win Arizona while 76 predict a Clinton victory.
The middle 50 percent of the predicted electoral college predictions range from 323 to 349 for Clinton and 186 to 215 for Trump. For this group (the middle 50 percent), the popular vote percentages range from 47.1 to 52.0 percent for Clinton and 40.4 to 44.6 percent for Trump. The middle 50-percent spreads for number of states won are 25 to 27 for Clinton and 22 to 25 for Trump.
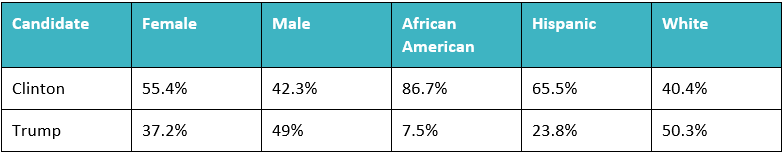
College students also had the option to predict the share of votes cast for Hillary Clinton and Donald Trump by various voter demographic groups. The following table indicates the averages for their results:
Share of Votes Cast by Demographic Group
The winners of the contest will be announced shortly after the official presidential election results become available. The first place winners will receive a prize package from ASA, including $200, a complimentary ASA membership, a guest column in the popular Sense about Science blog, and a Prediction 2016 T-shirt.
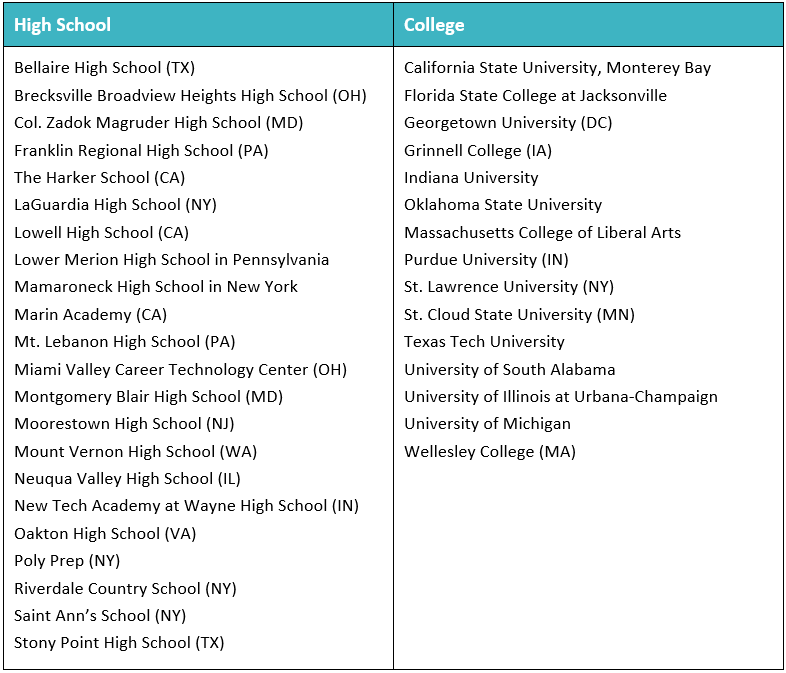
Special thanks to the following schools, colleges and universities that participated in Prediction 2016:
*The projection numbers are based on the median values provided by the students.