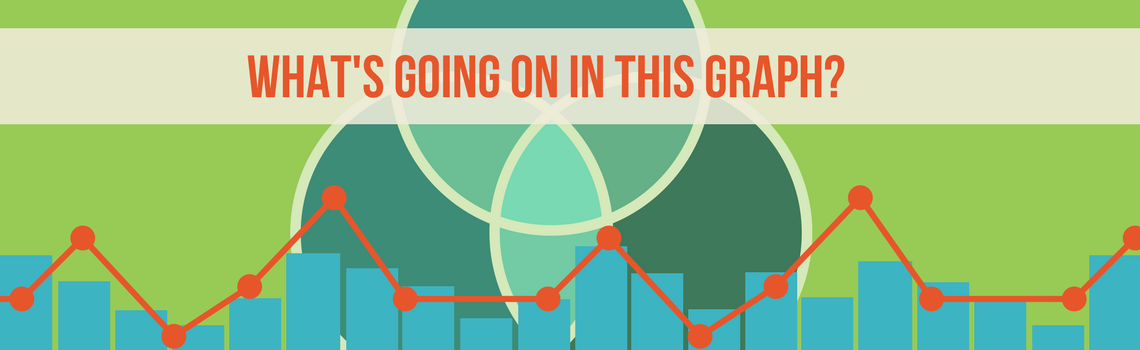
What’s Going On In This Graph?
December 12, 2017
ASA and The New York Times Learning Network released a brand new “What’s Going On In This Graph?” this morning.
Each month of the academic year (September to May), this ongoing feature shares a graph from a recent New York Times article, but stripped of its contextual information. Then it’s up to you to use your math, statistics and critical thinking to deduce what’s going on in the graph. (Teachers, share with your class for a great discussion.)
A new “What’s Going On In This Graph?” releases the second Tuesday of each month. On the day of a new release, ASA facilitates a discussion through the comments section from 9 a.m. to 2 p.m. ET.
Check out the latest feature here.
Related Posts

Hindsight Is 2023 for Former Statistics and Data Science Students
It’s back-to-school season! Gear up for the upcoming semester and consider diving into the captivating world of statistics and data science. Looking for diverse job opportunities that span across every industry? Look no further! With a variety of graduate programs and jobs, now is a great time for students to become data scientists and statisticians….

Elizabeth J. Kelly: “Statistics is for Adrenaline Junkies”
Elizabeth J. Kelly has always loved math, and as a professional statistician at Los Alamos National Laboratory (LANL) and a recreational rock climber, Elizabeth is an avid thrill-seeker who enjoys a challenge. “Math reminds me of climbing, including the need to focus, problem solve and persevere. I guess I ended up in statistics because I…