Back to School with Stats: ‘What’s Going On in This Graph?’ is Now Weekly!
September 11, 2018
Are you taking a statistics course this year? If you are, congratulations! You’re in for a fun and challenging course that will build important skills for your future, no matter what career you choose. Here’s what you can expect in the year ahead.
But don’t worry, even if you aren’t enrolled for a statistics course right now, you can still build your skills!
“What’s Going On in This Graph” was established to help you practice your critical thinking, math and statistics skills–plus, it’s fun! As it relaunches for the 2018-19 school year, it is becoming a weekly feature for students and teachers from The New York Times Learning Network and the American Statistical Association.
A new graph will be released from a recent article from The New York Times every Wednesday. The graph is stripped of its contextual information and it’s up to you to decipher its meaning. The following day, a live moderation will take place in the comments section of the article. Then, on Friday, the article’s title and meaning will be revealed. Are you up for the challenge?
A Classroom Resource
Teachers, “What’s Going On in This Graph” is a powerful activity that is now even easier to fit into your curriculum. You’ll also be provided a sneak peek of the content each Tuesday. By analyzing each weekly new graph, students have the opportunity to build confidence and acquire new conceptual understanding that will become more sophisticated over time.
Here’s how other teachers have implemented the activity.
Look for each week’s new graph here, and join the conversation online using #NYTGraphChat.
Reviewed by the This is Statistics Team 08/2023
Related Posts

Hindsight Is 2023 for Former Statistics and Data Science Students
It’s back-to-school season! Gear up for the upcoming semester and consider diving into the captivating world of statistics and data science. Looking for diverse job opportunities that span across every industry? Look no further! With a variety of graduate programs and jobs, now is a great time for students to become data scientists and statisticians….
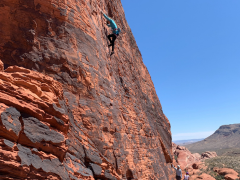
Elizabeth J. Kelly: “Statistics is for Adrenaline Junkies”
Elizabeth J. Kelly has always loved math, and as a professional statistician at Los Alamos National Laboratory (LANL) and a recreational rock climber, Elizabeth is an avid thrill-seeker who enjoys a challenge. “Math reminds me of climbing, including the need to focus, problem solve and persevere. I guess I ended up in statistics because I…